NFlowVis
Large-Scale Network Monitoring for Visual Analysis of Attacks
 NFlowVis is a system built in 2008 to analyze NetFlow data using a relational database system.
NetFlow records are linked with alerts from an intrusion detection system to enable efficient exploration of suspicious activity within the monitored network. Within the system, the monitored network is mapped to a treemap visualization, the attackers are arranged at the borders and linked using splines parametrized with prefix information.
High-Resolution Screenshot
The following picture shows attacks from the Internet to computers located at the University of Konstanz (brute force SSH attacks). The background represents the university’s network structure with computer systems as rectangles. External hosts are shown as colored circles on the outside. The splines represent the connections between attackers and computers within the network. This reveals a network scan (from top) and a distributed attack (bottom) originating from hundreds of hosts working together in attempt to break into specific computer systems.
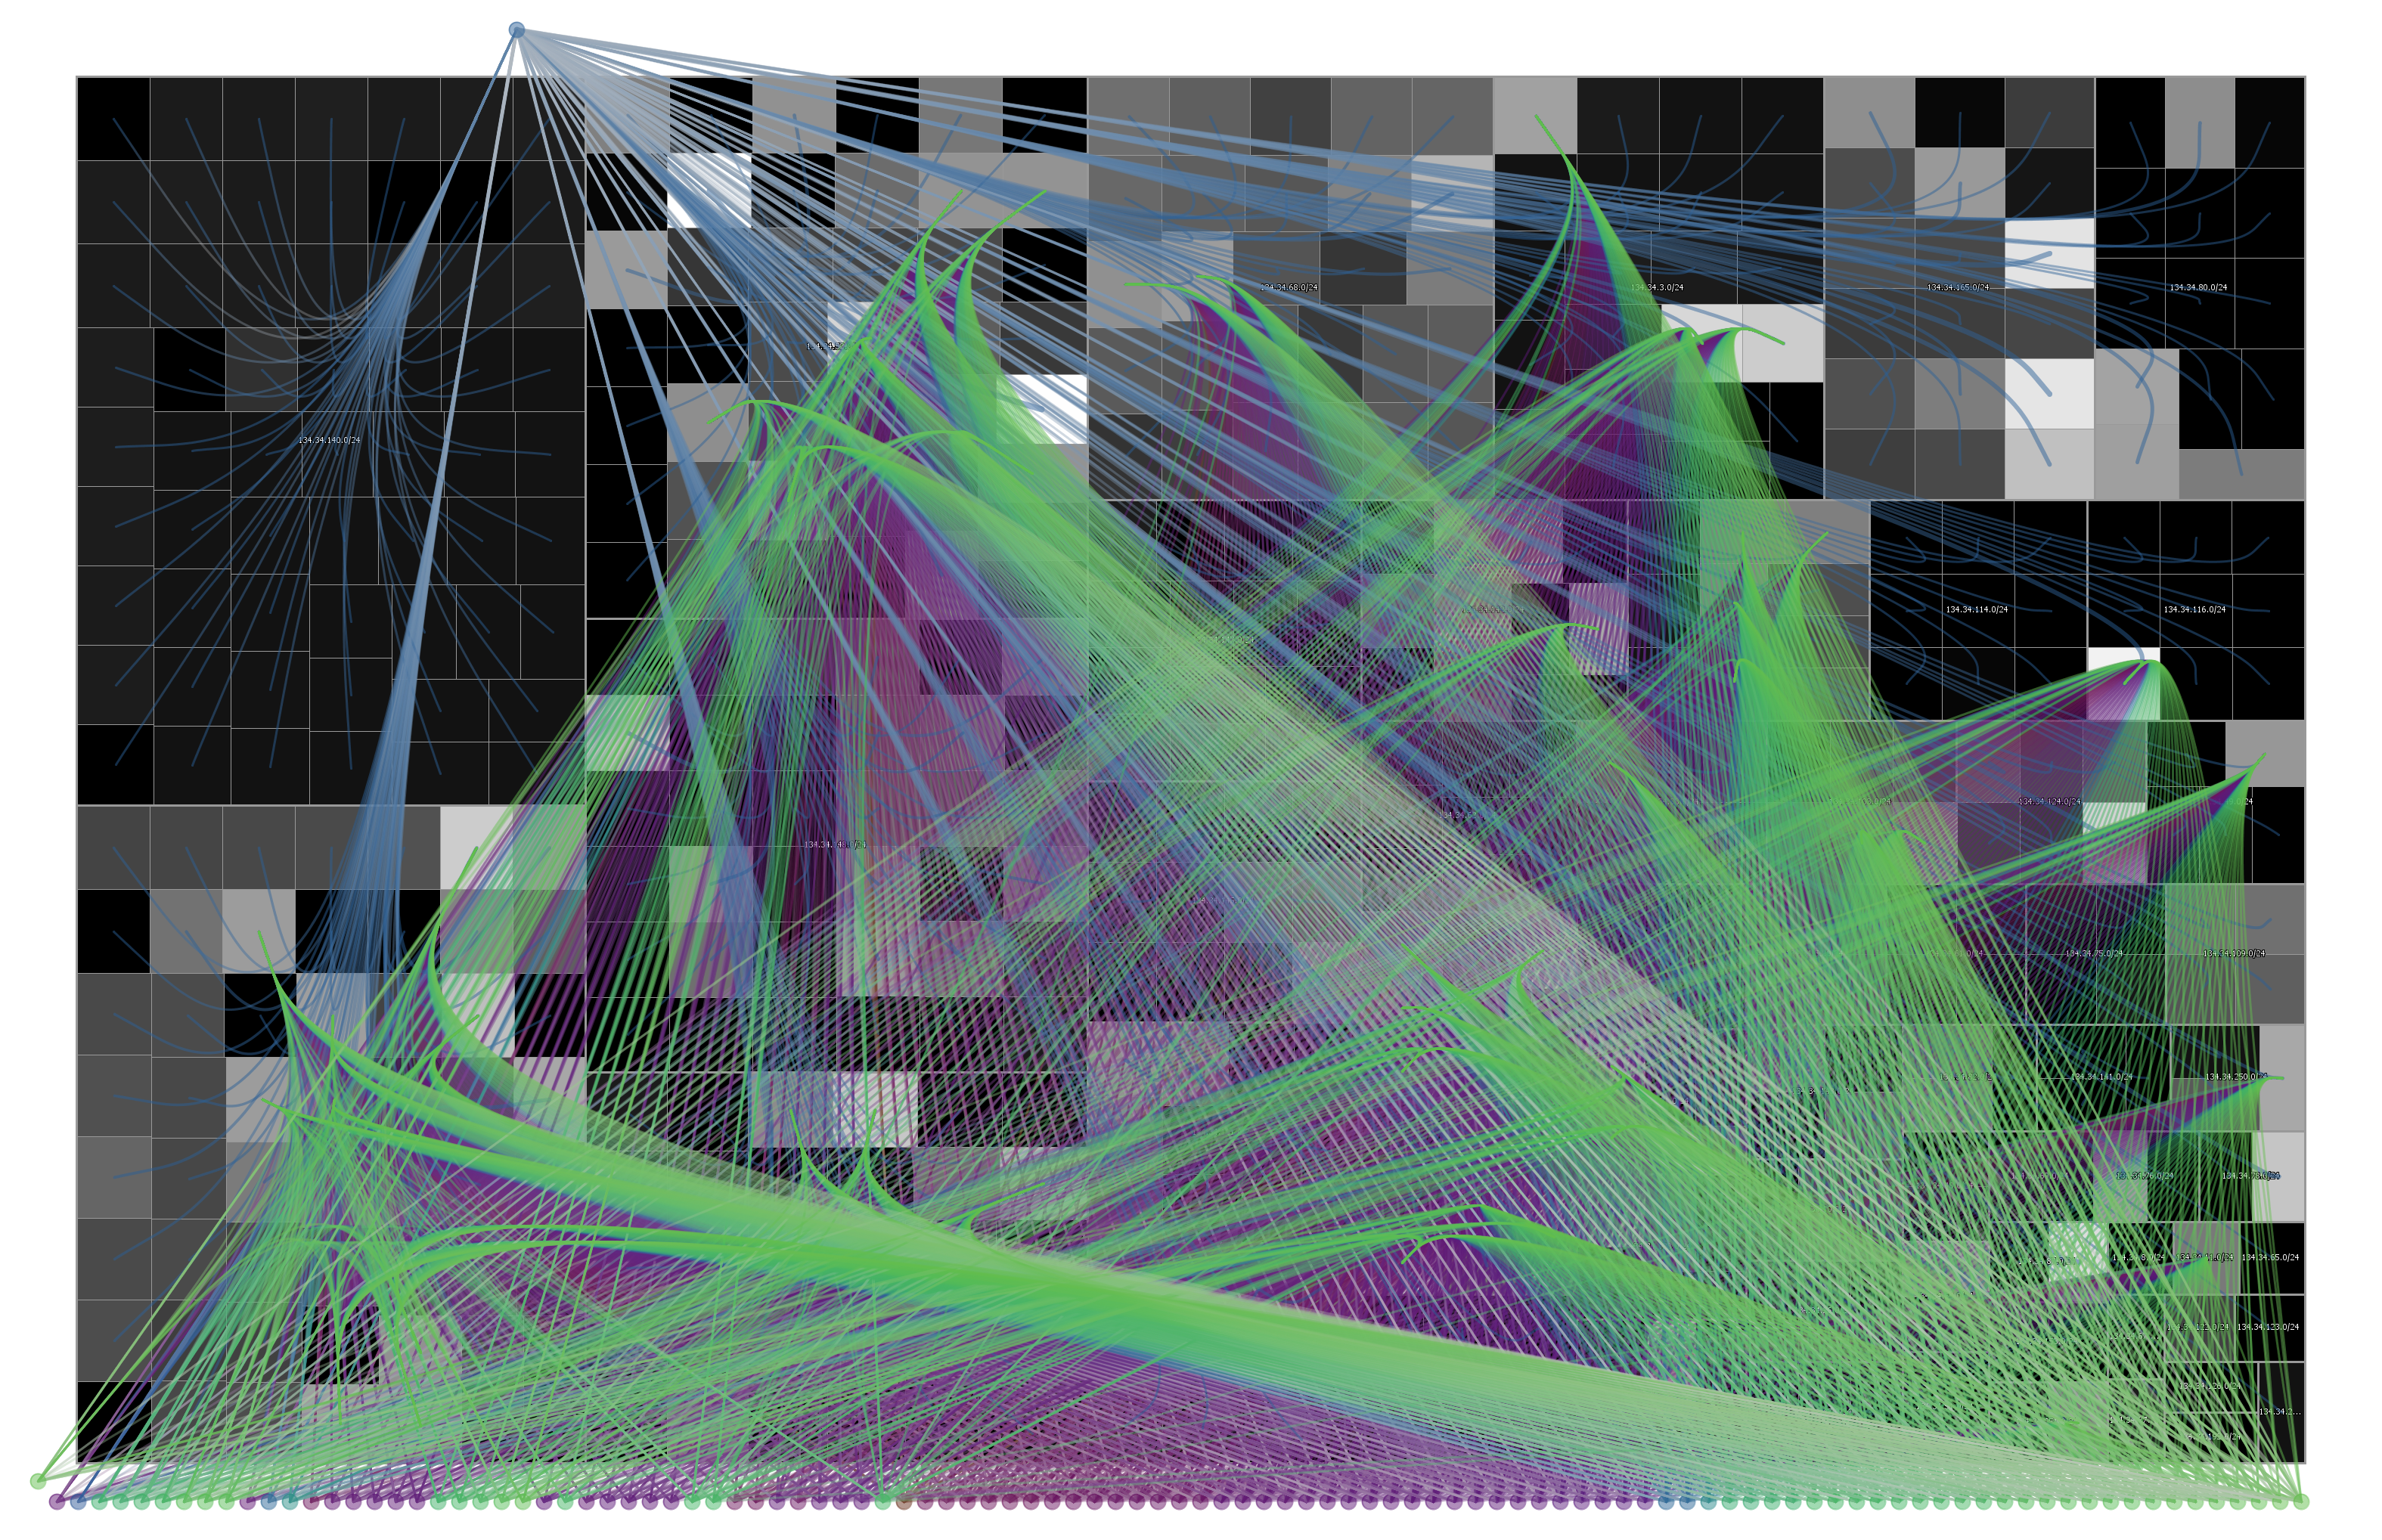
Feel free to download a High-Resolution Screenshot (10 MB, transparent background) of the NFlowVis visualization, which is licensed under CC BY 4.0.
Related Publications
- F. Mansmann, F. Fischer, S. C. North and D. A. Keim. Visual Support for Analyzing Network Traffic and Intrusion Detection Events using TreeMap and Graph Representations. Proceedings of the 3rd ACM Symposium on Computer Human Interaction for the Management of Information Technology (CHiMiT ’09), pages 19–28, 2009. (DOI, Paper, Slides)
- F. Fischer, F. Mansmann, D. A. Keim, S. Pietzko and M. Waldvogel. Large-Scale Network Monitoring for Visual Analysis of Attacks. VizSec ’08: Proceedings of the 5th international workshop on Visualization for Computer Security, pages 111–118, 2008. (DOI, Paper)