ClockMap
Enhancing Circular Treemaps with Temporal Glyphs for Time-Series Data
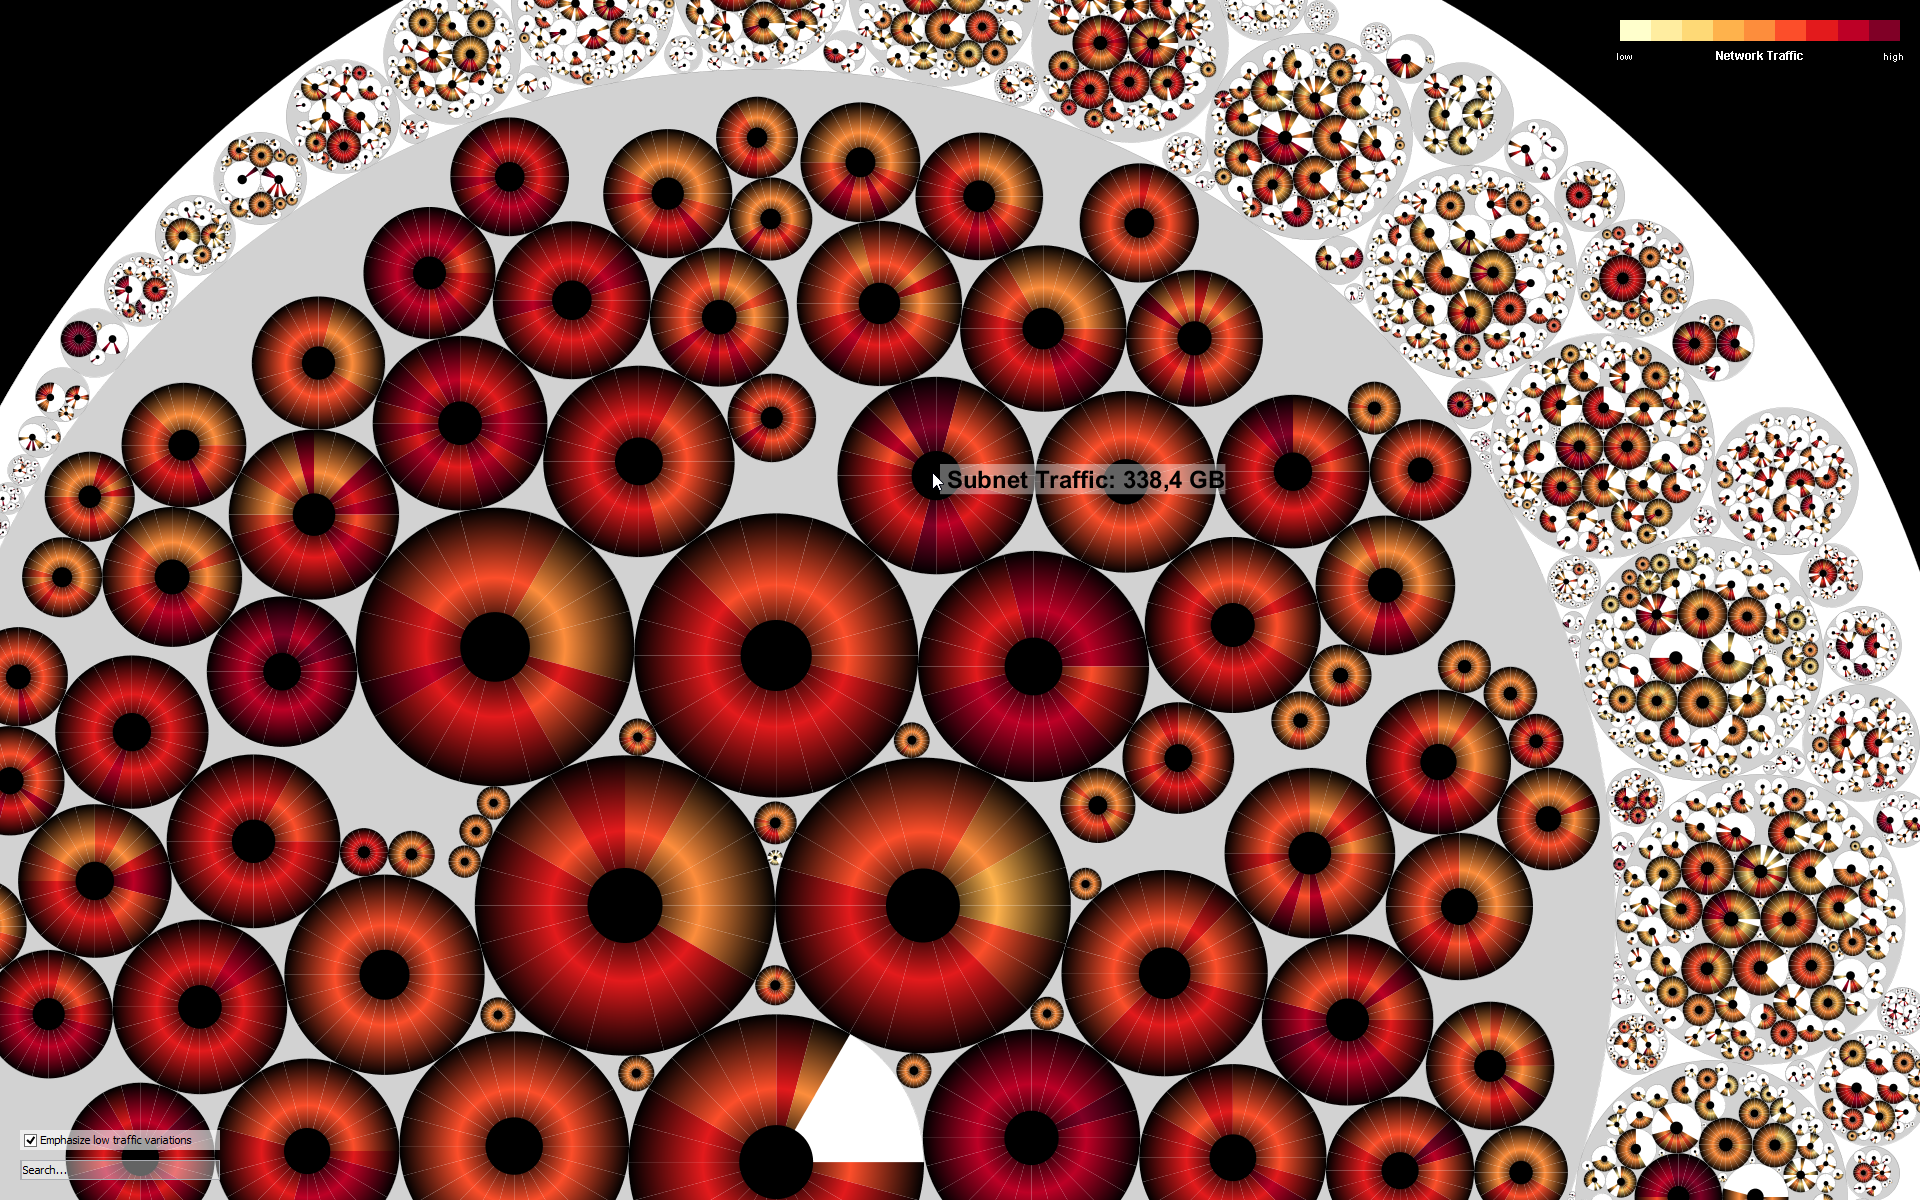
 Treemaps are a powerful method to visualize especially time-invariant hierarchical data. Most attention is drawn to rectangular treemaps, because their space-filling layouts provide good scalability with respect to the amount of data that can be displayed. Since circular treemaps sacrifice the space-filling property and since higher level circles only approximately match the aggregated size of their descendants, they are rarely used in practice. However, for drawing circular glyphs (see picture on the right) their shape preserving property can outweigh these disadvantages and facilitate comparative tasks within and across hierarchy levels.
We introduced the interactive ClockMap visualization in 2012, which effectively supports the user in exploring and finding patterns in hierarchical time-series data through drill-down, semantic zoom and details-on-demand. In this study, the technique’s applicability is demonstrated on a real-world dataset about network traffic of a large computer network and its advantages and disadvantages are discussed in the context of alternative layouts for better user experience.
ClockMap Technique
You can find a a demo and source code on GitHub.

Interaction: The project on GitHub is a limited version of the ClockMap technique which implements the basic idea. You can use the mouse wheel to zoom in and out. Hovering your mouse over the segments will give you information about the underlying data via tooltips. Clicking to a node in the deepest levels, will reveal the underlying leaf nodes.
Dataset: The shown data represents outgoing network traffic of 5691 hosts (anonymized and truncated) in a large computer network for 24 hours. The octets of the IP addresses (e.g., 1.2.3.4) are used as subnet hierarchy. White segments in the glyphs mean that there was no data transferred in the particular hours.
High-Resolution Screenshot
Feel free to download a High-Resolution Screenshot (3 MB) of a screenshot of the ClockMap visualization, which is licensed under CC BY 4.0.
Algorithm Implementations for Circular Treemaps
- Werner Randelshofer. Visualization of Large Tree Structures. (Website)
- Kai Wetzel. Pebbles: Using Circular Treemaps to Visualize Disk Usage. (Website)
Related Publications
- F. Fischer, J. Fuchs and F. Mansmann. ClockMap: Enhancing Circular Treemaps with Temporal Glyphs for Time-Series Data. Proceedings of the Eurographics Conference on Visualization (EuroVis 2012), 2012. (DOI, Paper, Slides)
- C. Kintzel, J. Fuchs and F. Mansmann. Monitoring Large IP Spaces with ClockView.
Proc. of Int. Symp. on Visualization for Cyber Security (VizSec), 2011. (DOI, Paper)